
SOURCE URL: https://www.advisorperspectives.com/commentaries/bp_51412.php
Adaptive Asset Allocation: A True Revolution In Portfolio Management
Modern Portfolio Theory (MPT) has been derided by practitioners, academics, and the media over the past ten years because the dominant application of the theory, Strategic Asset Allocation, has delivered poor performance and high volatility since the millennial technology crash.
Strategic Asset Allocation probably deserves the negative press it receives, but the mathematical identity described by Markowitz in his 1967 paper is axiomatic in the same way Pythagoras' equations describe the properties of right triangles, or Schrodinger's equations describe the positional probabilities of electrons.
The math is the math. Bear with me.
Modern Portfolio Theory requires three parameters to create optimal portfolios from two or more assets:
- Expected returns
- Expected volatility
- Expected correlation
Strategic Asset Allocation applies MPT using long-term averages of these parameters to create diversified portfolios that theoretically maximize the excess returns of the portfolio per unit of volatility.
The problem with Strategic Asset Allocation is not the math of MPT - the problem is with the assumption that the best estimates for returns, volatility and correlations are the long-term averages. Garbage In: Garbage Out (GIGO).
GIGO: Returns
The magnitude of this error in assumptions cannot be overstated because long-term averages hide enormous variability over shorter periods which can be observed and utilized for better portfolio assembly.
...
In other words, a retirement constructed using long-term average return estimates is analogous to a game of retirement Russian Roulette, where luck alone decides your fate.
Garbage long-term average estimates in: garbage portfolio results out.
...
Return, volatility and diversification estimates vary widely from their long-term averages over the short and intermediate terms. Managers who do not monitor and adjust portfolios to these changes risk substantial deviation from stated portfolio objectives, and are almost certain to deliver a sub-optimal experience for investors.
The Objective of Portfolio Optimization
One of the most important axioms in finance is that the best estimate of tomorrow's value is today's value.
Which begs the question: If we can measure the value of these variables over the recent past, and they are better estimates over the near-term than long-term average values, why don't we use current observed values for portfolio optimization instead? Why would we choose to hold a static asset allocation in portfolios when it is possible to adapt over time based on observed current conditions?
It is worth noting that the overall objective of asset allocation is to deliver the highest returns per unit of volatility. In finance, this is called the Sharpe ratio*.
You may wonder why we don't we just focus on returns. Well, one reason is that higher risk portfolios are much more difficult to stick with. While we may know logically that stocks deliver reasonable long-term returns, we may find it difficult to ride out sustained losses of 50%, 60% or greater on the way to our promised long-term growth. Under such circumstances most of us will cry 'Uncle' at the wrong time and permanently harvest a large loss.
That's why in our examples below we also highlight a measure called "maximum drawdown," which describes the maximum peak-to-trough daily loss of each portfolio over the period under investigation. Between volatility and maximum drawdown we capture a substantial portion of meaningful risk.
For those in or near retirement, when evaluating the tests below remember that higher returns alone will not improve retirement income or sustainability. For retirees drawing income, or those within 5 years of retiring, the most important measure of portfolio performance is the returns/volatility ratio: the higher this ratio, the higher the sustainable retirement income from a portfolio.
Introducing Adaptive Asset Allocation
To illustrate the revolutionary advantage that accrues from using recent observed portfolio parameters to regularly adapt portfolios to changing market conditions, consider a portfolio consisting of 10 major global asset classes:
- U.S. stocks
- European stocks
- Japanese stocks
- Emerging market stocks
- U.S. REITs
- International REITs
- U.S. intermediate Treasuries
- U.S. long-term Treasuries
- Commodities
- Gold
Going back to 1995, if we held this basket of assets in equal weight, and rebalanced monthly, we would have experienced the following portfolio growth profile [Example 1].
Example 1: 10 Assets, Equal Weight Rebalanced Monthly
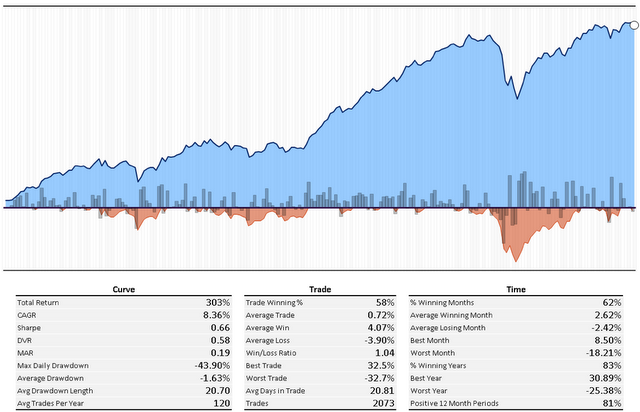
Source: Yahoo finance, DarwinFunds.ca.
We saw above in GIGO: Volatility above how volatile assets like stocks dominate the total risk of a typical portfolio, and the chart above provides further proof. But what happens if we observe the actual volatility of each asset in the portfolio over the past 60 days, and adjust the allocations at each monthly rebalance period so that each asset contributes the same 1% daily volatility to the portfolio, to a maximum of 100% exposure [Example 2]?
Example 2: 10 Assets, Volatility Weighted Rebalanced Monthly
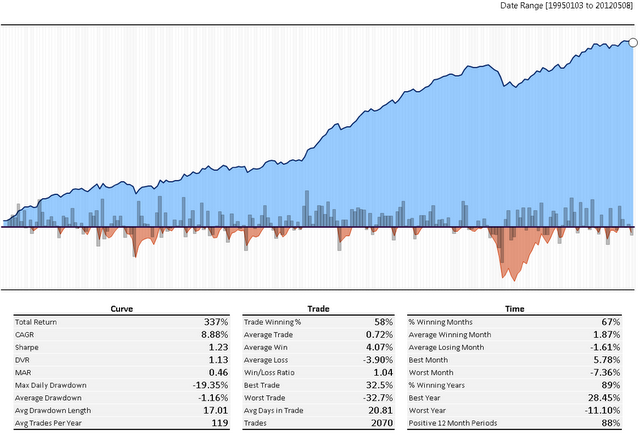
Source: Yahoo finance, DarwinFunds.ca.
By simply sizing each asset in the portfolio so that it contributes the same 1% daily volatility based on observed volatility over the prior 60 days, the return delivered per unit of risk (Sharpe) almost doubles from 0.66 to 1.23 versus the equal-weight portfolio, and the maximum drawdown is cut in half from 44% to under 20%.
This is a dramatic reduction in risk without sacrificing any returns. Aside from the reduced emotional burden this approach provides, it also very substantially boosts safe withdrawal rates for retirement or endowment portfolios, but that's a tale for another post.
Now let's re-introduce momentum as a better return estimate. We demonstrated how assets that have risen the most over the prior 6 to 12 months tend to continue to outperform over subsequent weeks. Momentum is therefore just a better way of estimating performance over the near-term future. So let's consider a new portfolio assembled monthly from the top 5 assets out of the 10 asset basket above, based on their performance over the past 6 months. This will be our pure Momentum Portfolio [Example 3].
Example 3: 10 Assets, Top 5 Equal Weight By 6-Month Momentum, Rebalanced Monthly
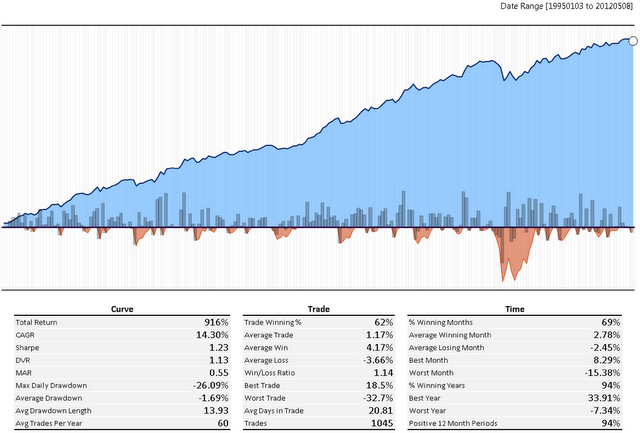
Source: Yahoo finance, DarwinFunds.ca.
You can see that by holding the top 5 assets each month based exclusively on their 6-month momentum, we again nearly double the Sharpe ratio, but we also substantially increase annualized returns - from 8.36% for the equal weight to 14.30% for our Momentum Portfolio. The average volatility for the momentum portfolio is slightly lower than the equal weight portfolio at 11.6% versus 12.7% annualized, and the drawdown is 40% smaller.
Our next step is to combine estimates of return based on momentum with estimates of volatility based on recent observed volatility. The following chart shows the performance of an approach that assembles the top 5 assets by 6-month momentum, and then applies the same volatility sizing overlay as we used in Example 2, so that each of the top 5 assets contributes the same 1% of daily risk to the portfolio, again to a maximum of 100% exposure [Example 4].
Example 4: 10 Assets, Top 5 By 6-Month Momentum, Volatility Weighted, Rebalanced Monthly
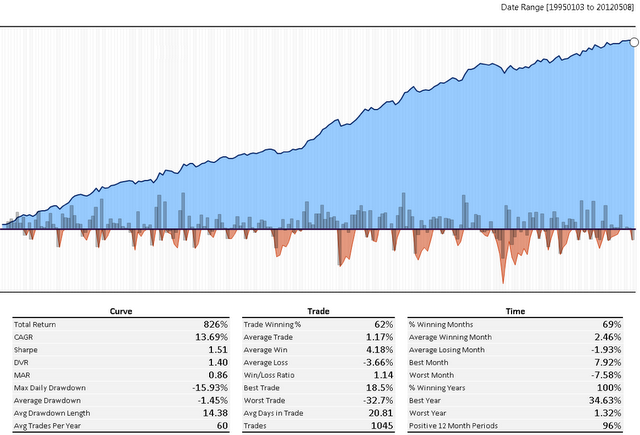
Source: Yahoo finance, DarwinFunds.ca.
This technique lowers returns slightly from 14.3% to 13.7%, but the Sharpe ratio increases from 1.23 to 1.51, and the maximum drawdown drops to 16% from 26%.
The next and final step is to integrate momentum, volatility and correlation using our improved return (momentum), volatility and correlation estimates to achieve true Adaptive Asset Allocation™ (AAA).
A novel approach to this might be to create portfolios at each monthly rebalance based on the Top 5 assets by 6-month momentum, but allocate among the assets according to a minimum variance algorithm rather than by volatility sizing each asset individually
The minimum variance algorithm takes into account the volatility and correlations between the Top 5 assets to create the momentum portfolio with the lowest expected portfolio level volatility. If we rebalance the portfolio monthly with this approach we achieve the following performance [Example 5.].
Example 5: 10 Assets, Top 5 By 6-Month Momentum, Minimum Variance, Rebalanced Monthly
Source: Yahoo Finance, DarwinFunds.ca.
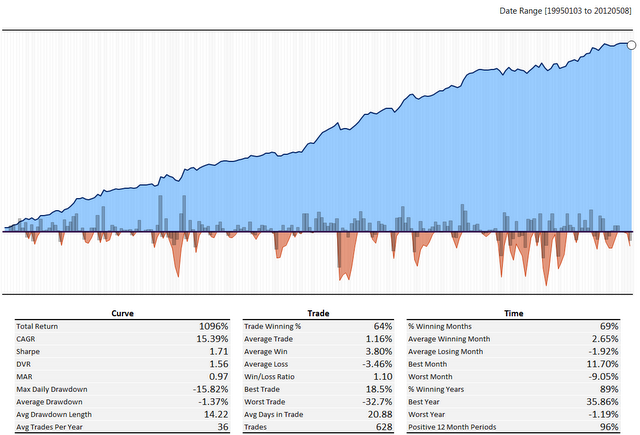
You can see that by integrating our last factor, correlation, we are able to achieve higher returns of 15.4% versus 13.7%, and with a substantially higher Sharpe ratio of 1.71 versus 1.51, while preserving the maximum drawdown profile under 16%.
The Next Generation of Portfolio Management
While there are much better algorithms to integrate momentum, volatility and correlation, the examples above show a clear evolution of techniques that demonstrate how to integrate the three primary variables used for portfolio construction under a true Adaptive Asset Allocation™ framework.
Portfolios assembled using classic Strategic Asset Allocation are vulnerable to the 'flaw of averages' where long-term average values hide enormous variability over time. Quantitative Tactical Asset Allocation suffers from considerably lower returns over time, and is vulnerable to changing market character. For example, QTAA has suffered recently because the dispersion of returns around monthly moving averages has increased by multiples over the past few years.
In contrast, Adaptive Asset Allocation™ (AAA) is robust to changes in market character because proper application uses a variety of standard parameter look backs for estimation. Further, volatility and correlation management, as well as more regular rebalance frequency, provides substantial tailwinds for portfolios. Lastly, AAA portfolios are always optimally diversified, which makes them robust to market shocks which wreak havoc on more concentrated tactical portfolios.
The portfolio management industry is undergoing a revolution analogous to the shift that occurred after Markowitz introduced his Modern Portfolio Theory in 1967. Managers who embrace the new methods will increasingly dominate traditional managers; those who fail to adapt will, inevitably, face extinction.
*Note: Technically, the Sharpe ratio is calculated using returns in excess of the cash yield, though we use a simple return/risk ratio in this article